

ProjectionLab is a powerful financial planning tool that empowers do-it-yourselfers to set and track financial goals and forecast how their wealth will change over a lifetime.
We can use it to experiment with various scenarios and assumptions to help us determine if we have enough to retire or achieve other financial milestones.
This retirement planning calculator is far more advanced than anything we could create in Excel. I recommend it for being a comprehensive, affordable, and extremely flexible tool.
There’s no more guessing and no more expensive financial advisors. DIY investors have access to planning tools on par with an advisor’s software at a fraction of the cost.
ProjectionLab is a highly customizable product that can model most scenarios in people’s financial lives.
The most comparable product to ProjectionLab is NewRetirement. I wrote a comprehensive NewRetirement review about a year ago. I compare the two products below.
You can play around with ProjectionLab for free, but you’ll need to pay to make a meaningful plan and save your data.
The cost is just $9 or $14 per month — a bargain compared to hiring a financial advisor or spending time building inferior spreadsheets.
Use the ProjectionLab coupon code “RBD-10” to save 10%.
ProjectionLab Review Video
I created a 15-minute video to demonstrate ProjectionLab. I’ve used a hypothetical couple, ages 48 and 50, with two college-bound children. They plan to stop working in 10 years.
I created this 15-minute video to demonstrate ProjectionLab. I’ve used a hypothetical couple, ages 48 and 50, who have two college-bound children. They plan to stop working in 10 years.
The video provides a high-level ProjectionLab review to introduce users to the platform. The best way to learn the tool is to get your hands dirty.
How ProjectionLab Works
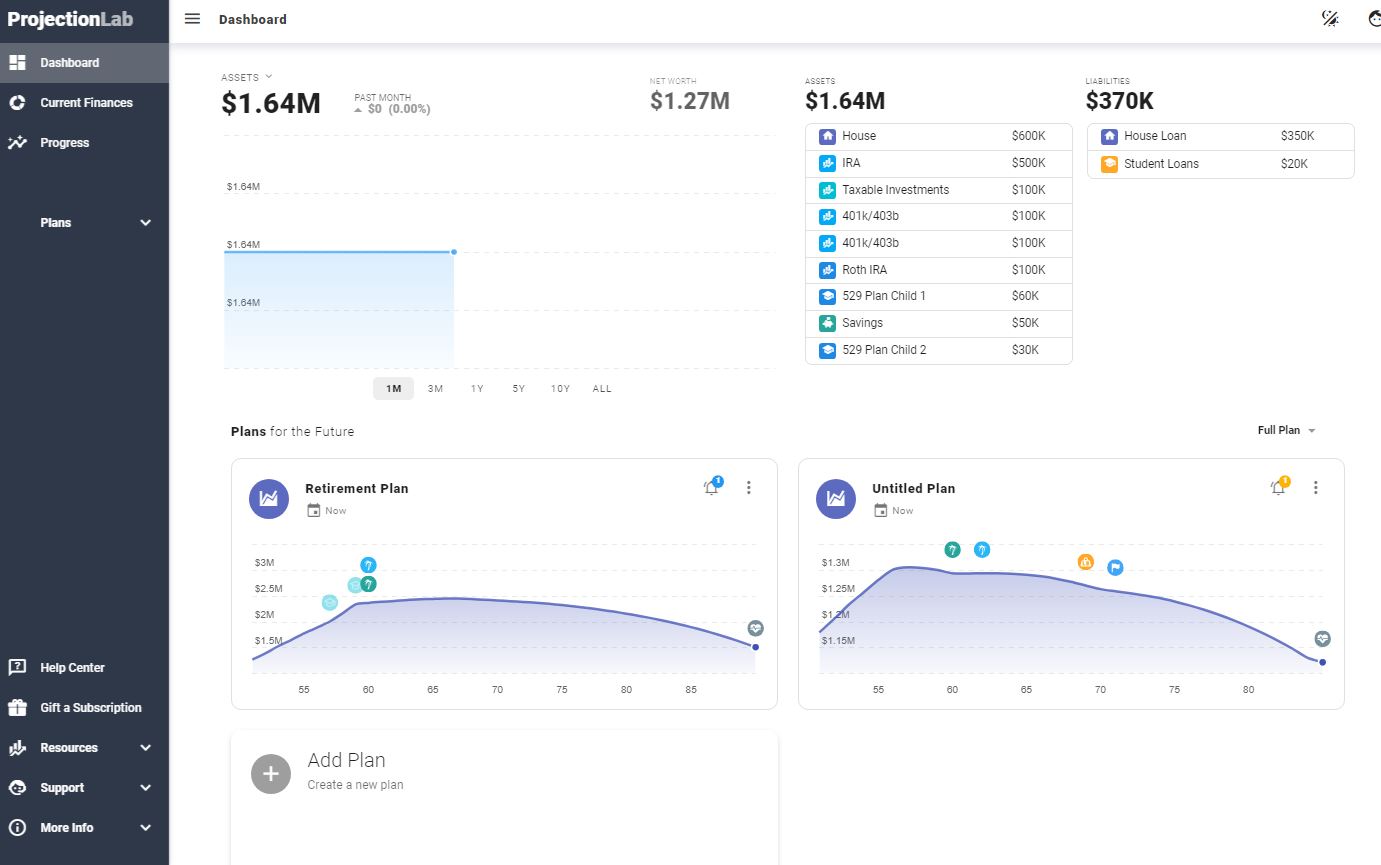
At the start, users input their age and financial account balance information. This includes cash, retirement and taxable accounts, and real estate holdings.
The onboarding process makes this very straightforward. When complete, the main Dashboard displays the inputs.
Once you’ve manually input your financial information, you create a baseline plan to include whatever goals you wish to pursue (e.g., retirement, debt freedom) and determine the likelihood of achieving those goals on time, and your chances of success.
You can modify inputs (and behaviors) to increase plan viability if you’re not on track.
The inputs are the foundation for the plan. A comprehensive retirement plan is ultimately a detailed and customized projection of wealth for your lifetime.
Creating a Plan
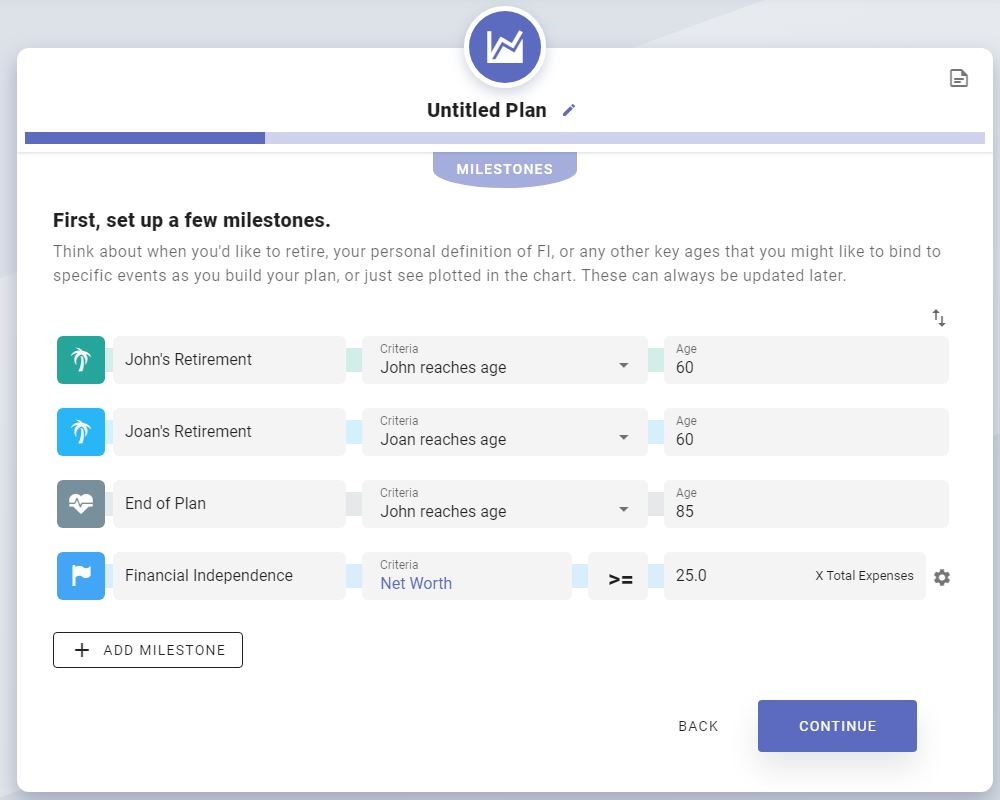
ProjectionLab analyzes your current financial situation using plans and milestones and projects how your income, account balances, and expenses will evolve as you age.
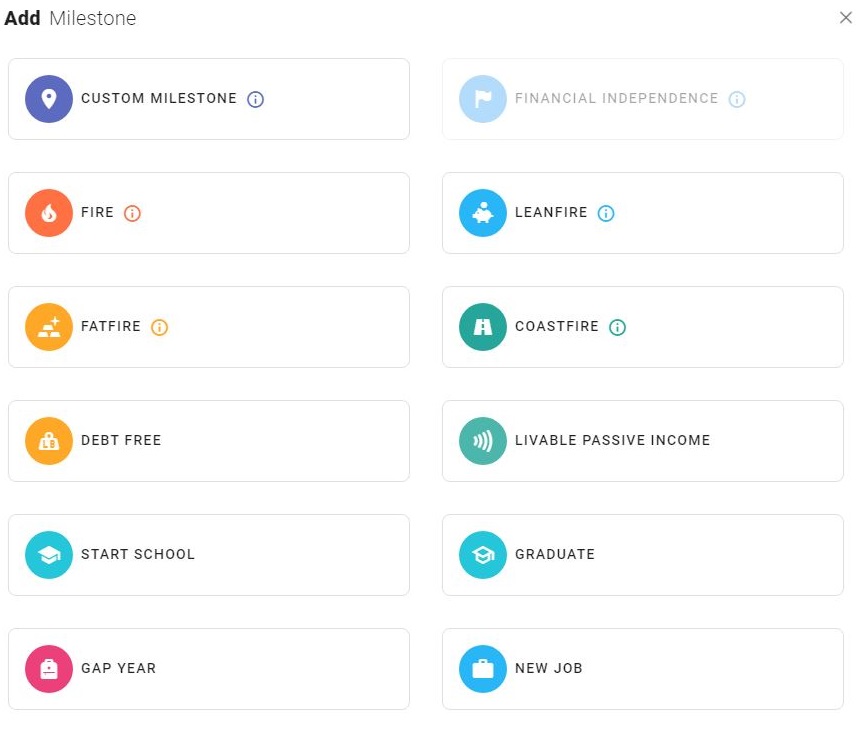
A basic plan includes retirement age and end of life, but you can also add debt freedom, education expenses, FIRE, and other milestones.
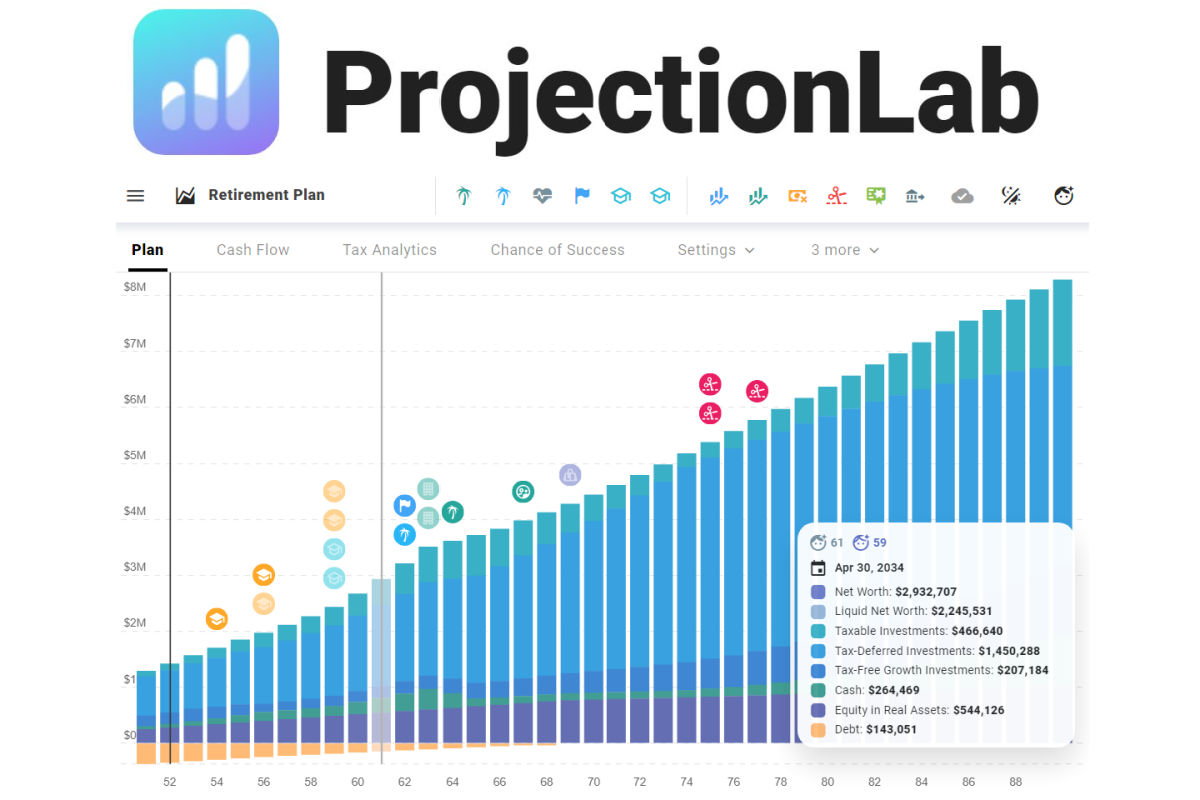
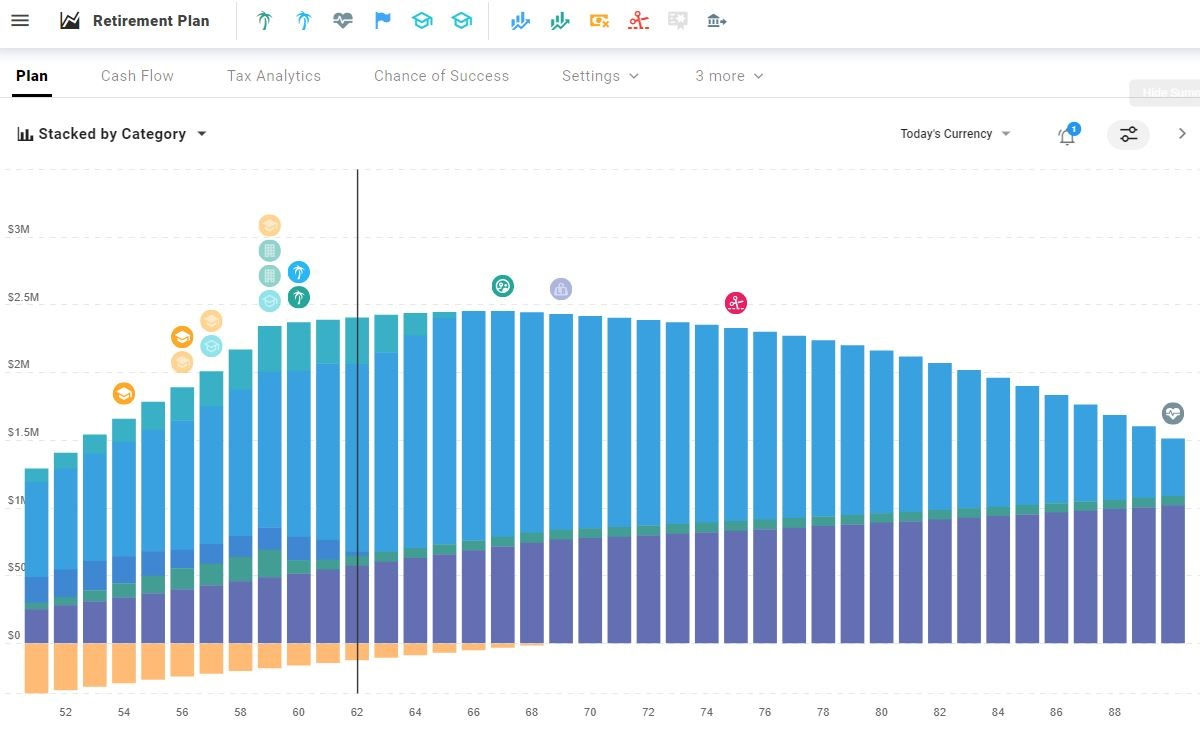
These milestones become markers on the primary planning visualization timeline as seen below. The timeline shows the user’s net worth from the current year until end of life.
Below is the stacked-by-category view. The colors represent the different types of accounts (e.g., cash, debt, real assets, IRA, Roth).
The goal is to have enough money throughout the plan and money left over if you want to leave a legacy.
You’ll get the details shown below when you hover over the chart.
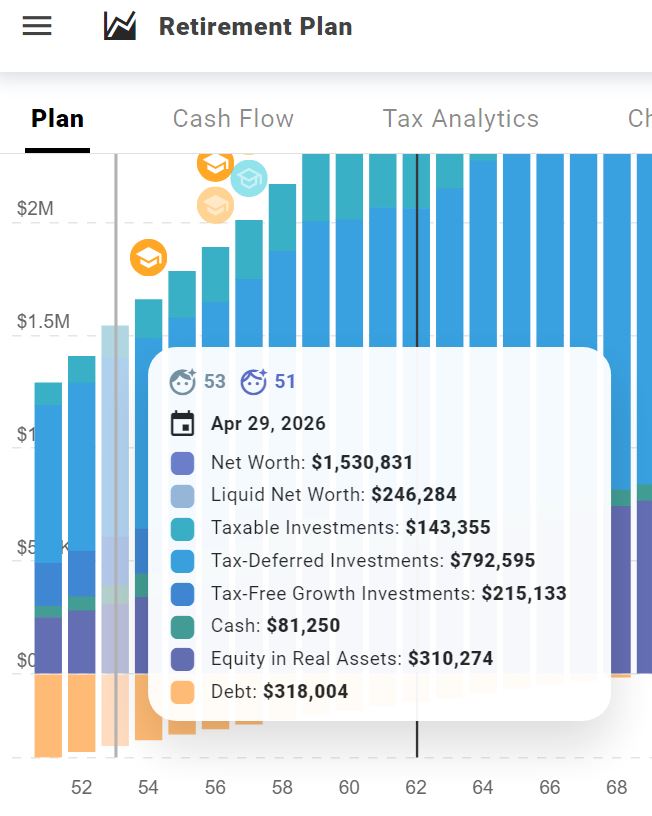
In one visualization, we can estimate how our wealth will evolve given a large set of inputs, milestones, and assumptions.
Cash Flow View
The Plan view is the main visualization. There’s also a Cash Flow view that uses a Sankey diagram to show where spending money money comes from and where it goes.
Sankey diagrams have become popular images for visualizing corporate revenues, expenses, and profits. They also work well for personal finances.
As the plan matures, cash flow changes. In this screen capture, the couple pays for primary expenses and saves money with salaried income.
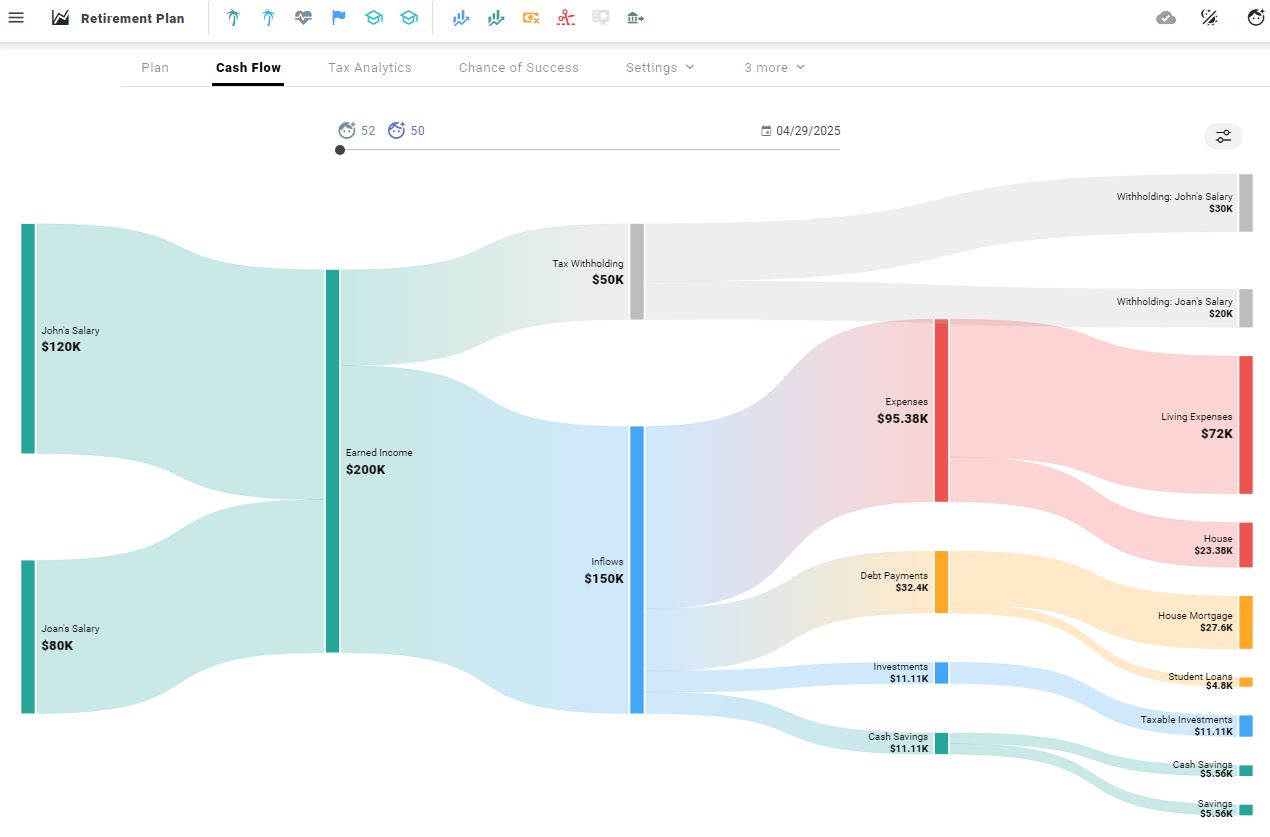
After retirement, they rely on withdrawals from various accounts. ProjectionLab has an optimized default order in which withdrawals draw down savings, but you can customize it however you like.
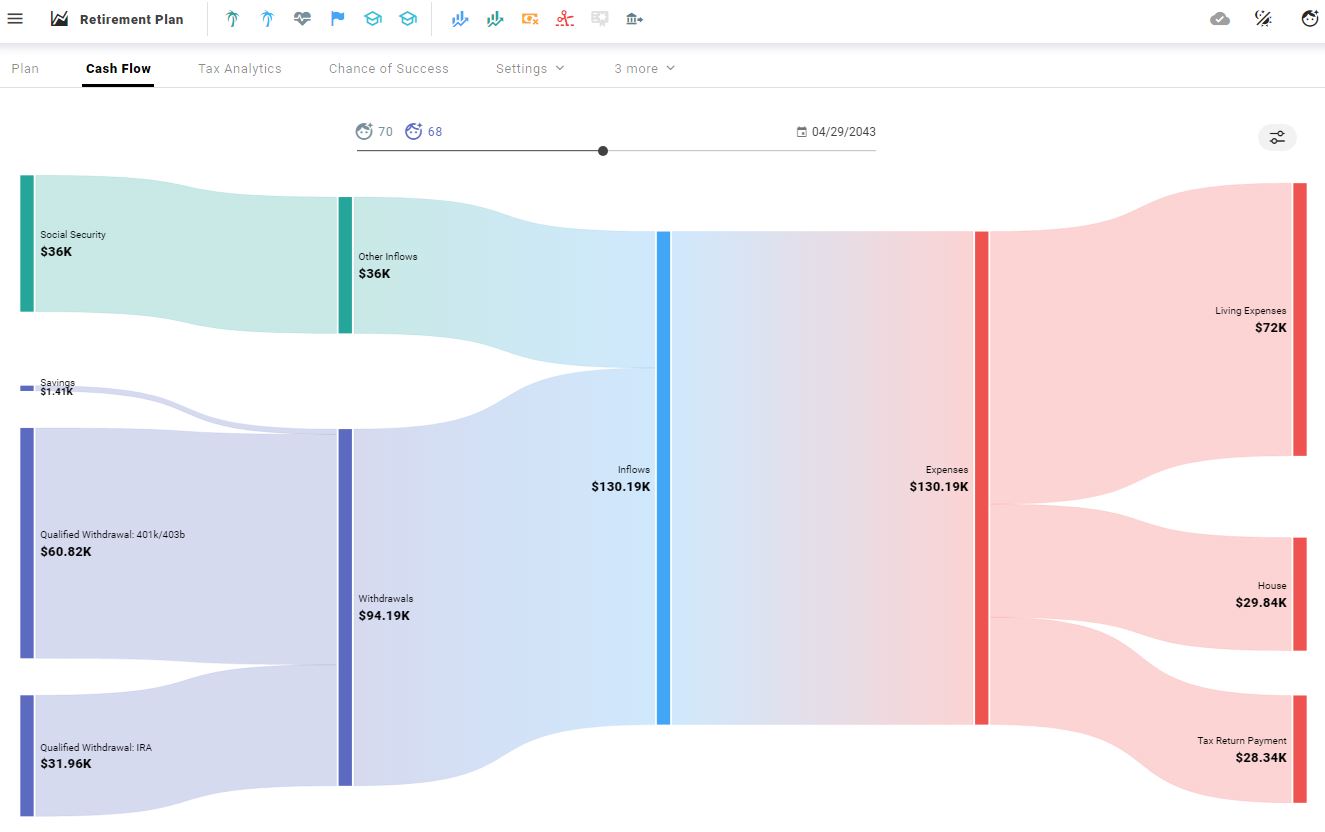
The Cash Flow view has a mini timeline you can drag to a specific age to see how it projects cash flow to move. The screen capture below shows the anticipated cash flow view when John is 70.
This plan shows income from Social Security, savings, and retirement accounts.
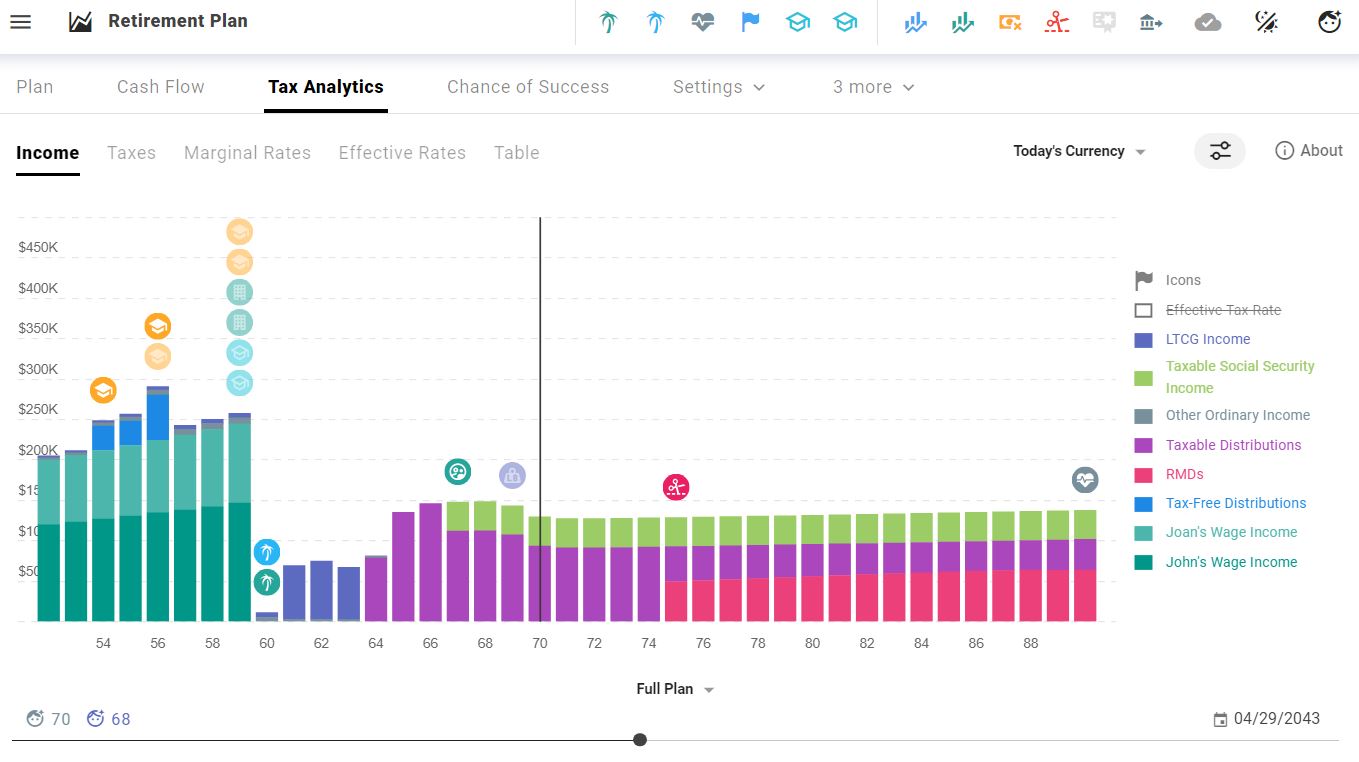
Tax Analytics View
The sandbox and free usage of ProjectionLab exclude the Tax Analytics view.
There are a few variations of this view. It shows the income items that are subject to taxes over the plan’s life, plus tax amounts, marginal rates, and effective rates.
This couple transitions from salaried income taxes to long-term capital gains, taxable distributions, Social Security, and required minimum distributions (RMD).
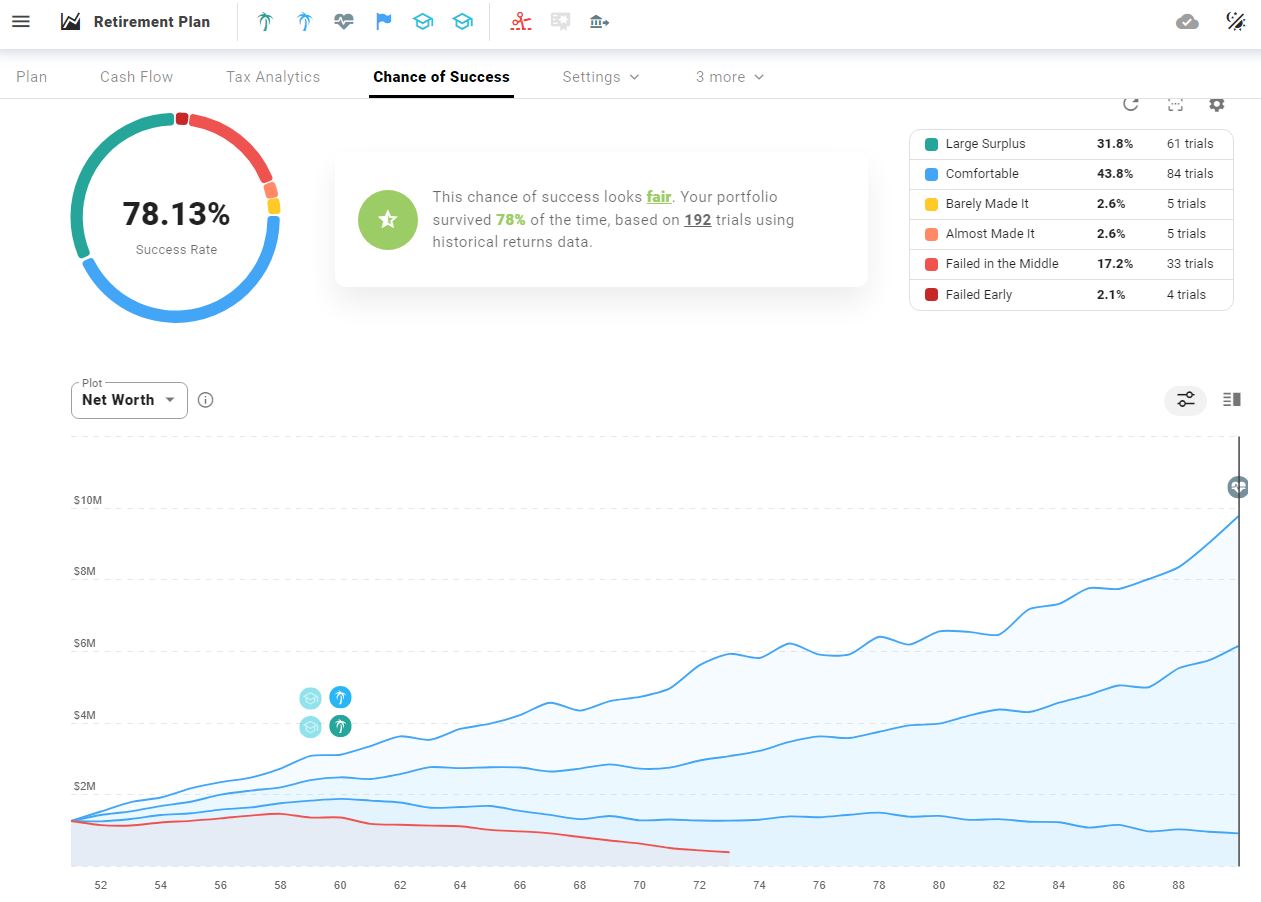
Chance of Success (Monte Carlo)
Chance of Success is the next plan tab that runs a few hundred scenarios to determine the likelihood of a plan’s success based on historical data (sequence of returns).
Every time you modify your plan, you can rerun the simulation to update the chances of success.
My example shows a 78% success rate, but by changing the market returns, bond allocation, or retirement date just a bit, I can easily increase the chances of success.
If John works for four more years, his plan’s success likelihood is 100%.
It shows how working longer, saving more, or earning higher returns can impact long-term outcomes.
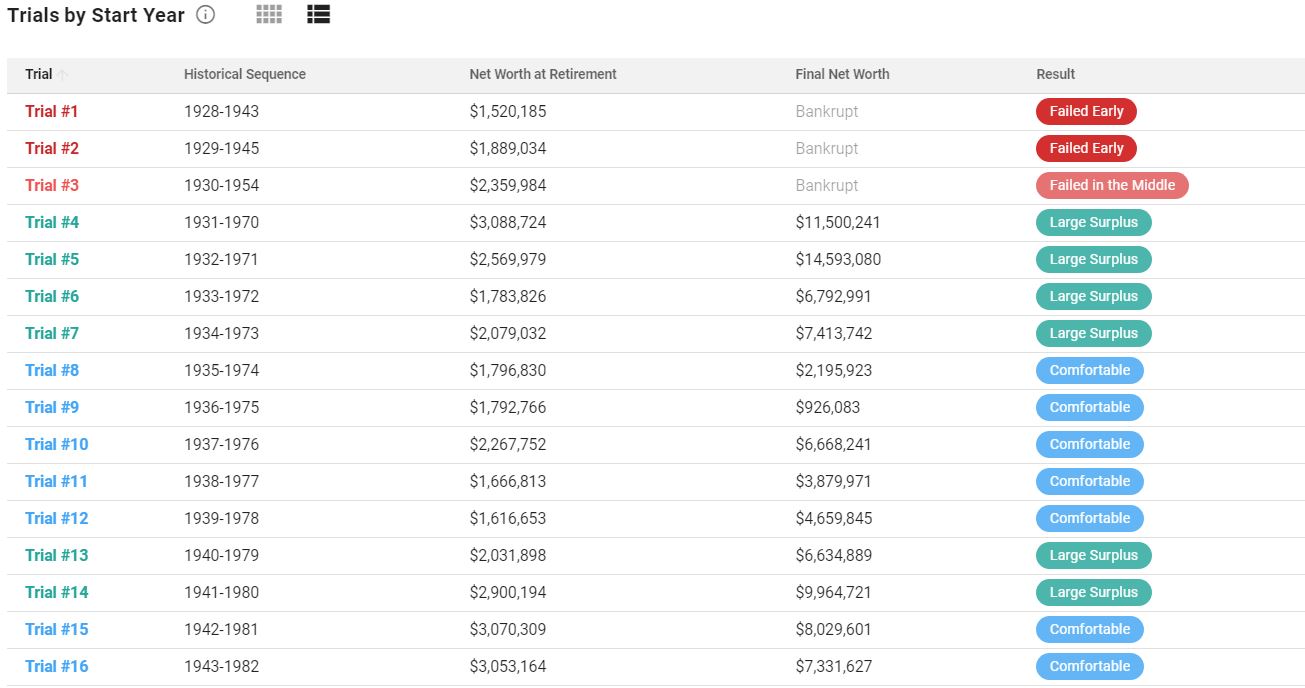
If you scroll down, you can see a table of the breakdown of the Monte Carlo simulation, which shows how the plan would have performed starting each year and going back to 1928.
The retirement year matters!
Settings
The last tab I want to highlight is settings. ProjectionLab gives you two places to access the plan settings.
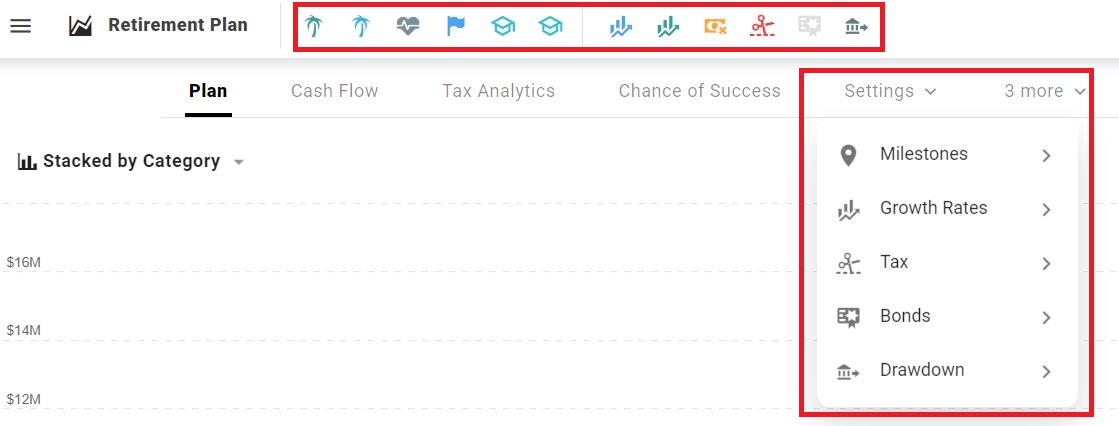
Next to the plan title is a shortcut bar to quickly access settings.
There’s also a settings drop-down that is more comprehensive. It includes:
- Milestones are what you set up in the original plan.
- Growth rates are market returns, dividend yield, and inflation.
- The tax settings can be defaulted or highly customized.
- Bonds can be customized by allocation (stock to bond), dividend rate, and growth rate.
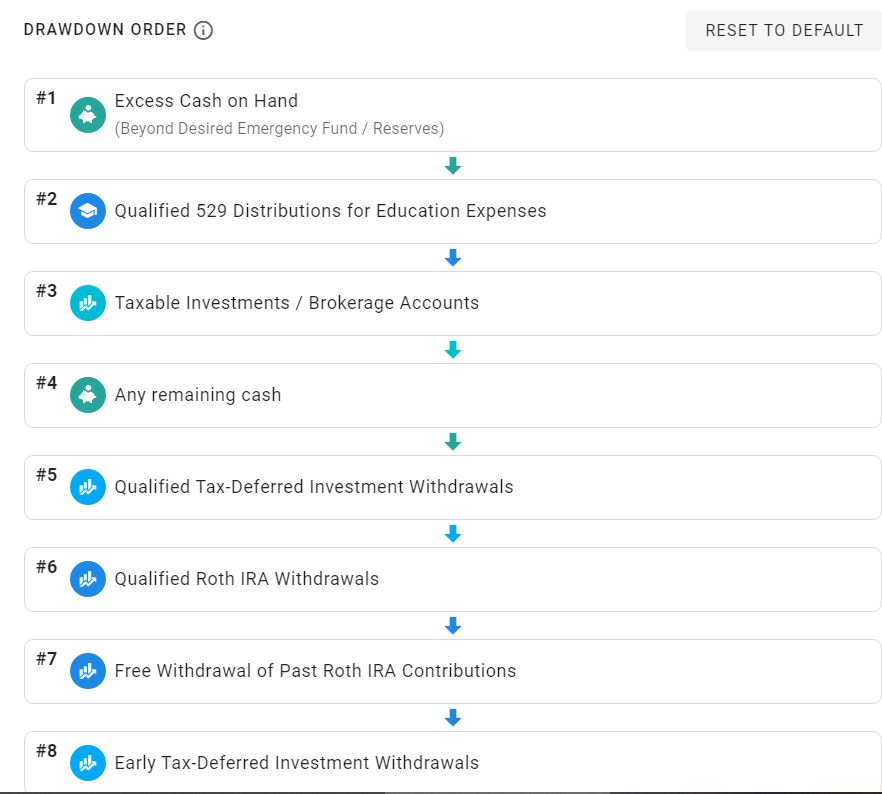
- Draw-down order sets a default order or allows you to customize.
The draw-down order significantly impacts the plan because of the various tax implications of withdrawing from different types of accounts.
Drag and drop to change the order.
ProjectionLab vs. NewRetirement
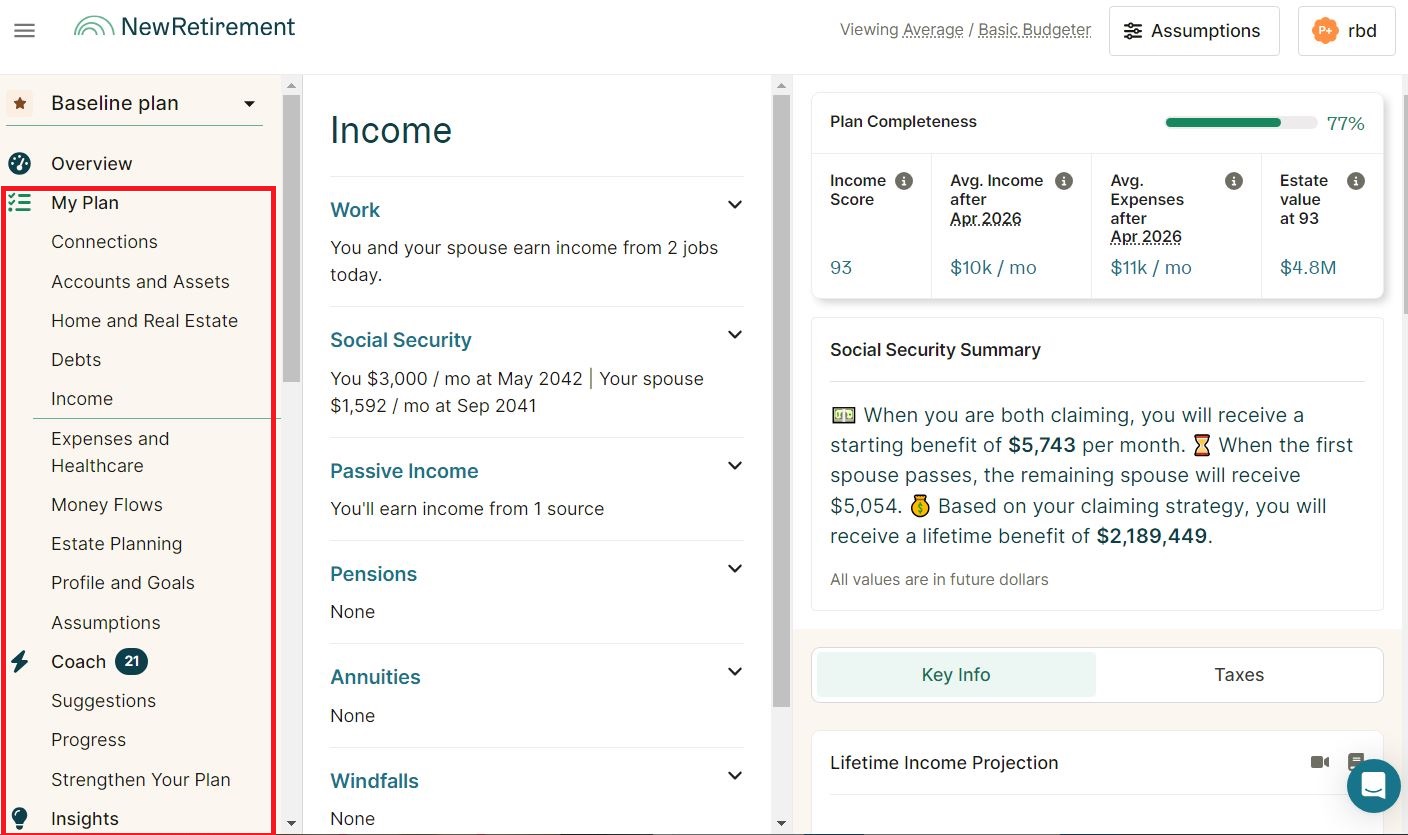
NewRetirement is an older and more established software that caters to DIY investors, professional financial planners, and media websites. It also has institutional partnerships and licenses its software to financial services providers.
Like ProjectionLab, it lets users input data and assumptions to map out their finances from today until the end of life and visualize the results.
A big differentiator is that NewRetirement allows users to import data automatically. While this is convenient when it works, there can be connectivity issues.
ProjectionLab’s manual input may be tedious for someone with many accounts. But manual inputs are harmless for a casual user if you don’t have many accounts.
There is a new plugin API that allows users to sync from budgeting tools like YNAB, and more are expected in the future. Data importation is among the top requested features.
From a user experience perspective, NewRetirement is a bit more linear in how you progress through setting up and modifying a plan. ProjectionLab has a more open-world feel and is graphically more pleasing.
Younger users may feel at home in the Discord community, where power users share tips, and the ProjectionLab team announces updates and accepts feedback.
NewRetirement steps you through creating and modifying your plan rather methodically, while ProjectionLab asks some questions upfront. Then, planners use a freestyle approach to modify and tweak inputs. The outputs adapt on the fly.
The linear approach may appeal to those who prefer a more structured walkthrough, while the more open-world ProjectionLab is highly responsive and may appeal to a younger audience.
NewRetirement has more charts, robust insights, and capabilities, which is no surprise. The company has a large team of developers and has been building the tool for a decade, while ProjectionLab has been a one-person development project since the beginning.
Lastly, the NewRetirement basic plan offers more for free than ProjectionLab. But to fully experience the benefits of either tool, paying is the way to go.
Unfortunately, free tools like the once-great Personal Capital (now Empower) and Mint have unfortunately fallen apart over the years.
Mint is gone, and Personal Capital’s purchaser hasn’t innovated to keep up with ProjectionLab or NewRetirement. The connectivity is clumsy and frustrating (yet the sales calls don’t cease).
So, I’m less enthusiastic about Empower than I used to be. It’s better to pay for a premium tool that works well than a free legacy tool that isn’t improving.
If you’re seriously engaged or even casually involved with managing your money and ready to move beyond elaborate spreadsheets, try ProjectionLab and NewRetirement and choose the most intuitive and comfortable for you.
ProjectionLab Pricing
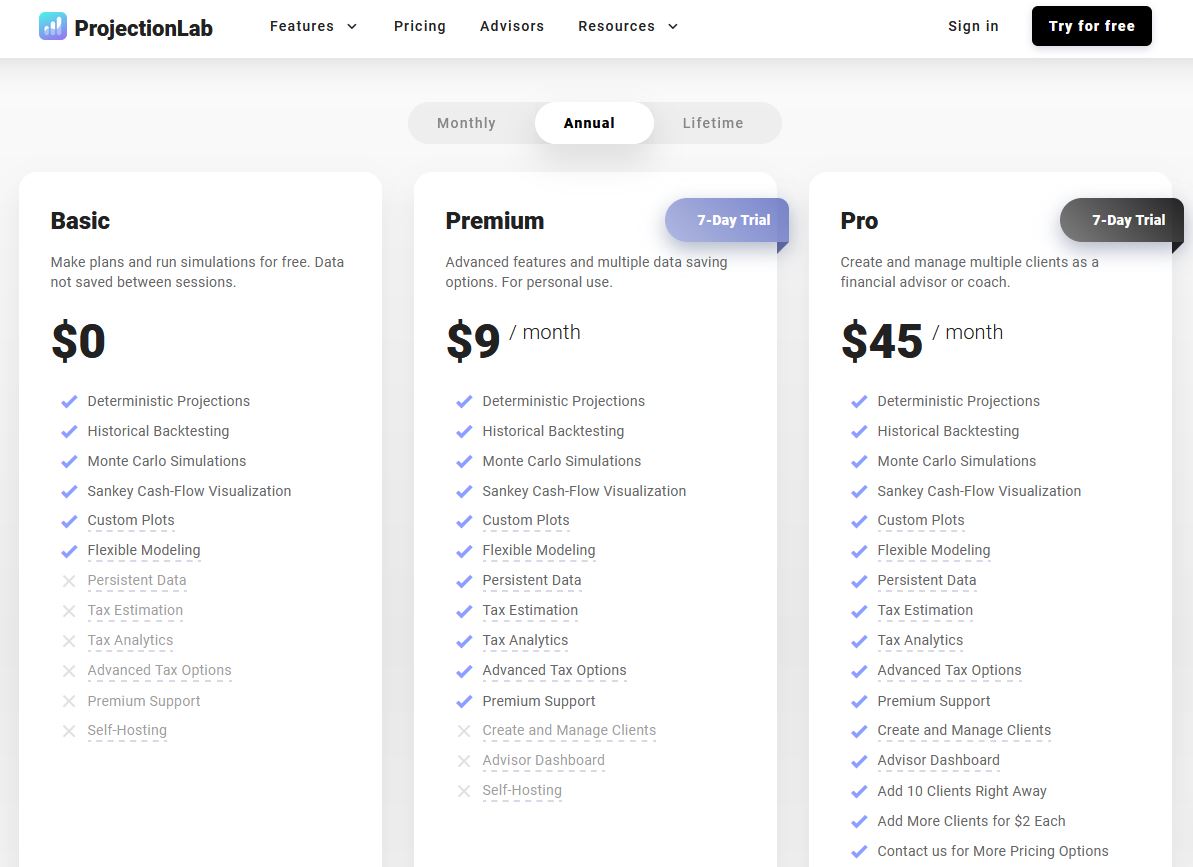
ProjectionLab’s basic and free version is somewhat limiting. You can try most of the functionality, but once you log out, your plan is gone.
Anyone serious about managing their retirement money should look at the Premium plan. It’s $9 per month if you pay annually ($108 + tax) or $14 per month.
Use the ProjectionLab coupon code “RBD-10” to save 10%.
ProjectionLab Review: Conclusion
Overall, ProjectionLab is an excellent financial planning tool targeted at individuals and do-it-yourselfers. It’s far more customizable than any spreadsheet you could dream of, and ready to use out of the box.
It takes a bit of getting used to. But the more time you spend in the tool, the more you’ll value its capabilities as your update your plan.
ProjectionLab doesn’t have as many features as NewRetirement yet, but its developers are in close contact with its user base and can prioritize the most requested features and functionality. In time, I expect ProjectionLab will have all the bells and whistles that are useful for users without unwanted features that clutter the user experience.
Many of us have relied on free net worth trackers and elaborate spreadsheets to analyze our money and try to forecast our financial futures.
It’s time to move on. Paid tools are reasonably priced and exceedingly capable of providing DIY financial enthusiasts with critical information for planning their futures.
Try ProjectionLab and see if it’s right for you and your financial plans.
ProjectionLab Review
-
Ease of Use – 8.5/10
-
Features – 8/10
-
Cost – 9/10
-
Value – 9.5/10
-
Mobile Experience – 10/10
-
Transparency – 10/10
9.2/10
ProjectionLab Summary
ProjectionLab has a relatively steep learning curve when getting used to the platform. But once you get the hang of it, the tool is intuitive for building and modifying new plans. The product was developed in public with open transparency, and there’s an active user community on Discord where users can ask questions and suggest improvements. At $9 per money (paid annually, it’s a small price for enormous benefit. Those seeking freebies should look elsewhere. The tool gives individual insights similar to what a financial planner can offer at a fraction of the cost. Users serious about managing their own retirement should not do so without this tool or similar. Finally, this modern platform is built on a modern technology stack. Users can move between desktop and mobile without any usage degradation.
Pros
- Modern user interface
- Powerful flexibility to build and modify plans
- Excellent mobile experience
Cons
- No financial account connectivity for automatic updates
- Limited free usage
Disclosure: RBD is an affiliate partner with ProjectionLab. RBD may receive a commission for readers who sign up for ProjectionLab and pay to use it. RBD content is free. Partnerships like this one help to support this website. RBD only reviews products and services that are recommended. The opinions expressed in this ProjectionLab review are solely of the author.

Craig Stephens
Craig is a former IT professional who left his 19-year career to be a full-time finance writer. A DIY investor since 1995, he started Retire Before Dad in 2013 as a creative outlet to share his investment portfolios. Craig studied Finance at Michigan State University and lives in Northern Virginia with his wife and three children. Read more.
Favorite tools and investment services right now:
Sure Dividend — A reliable stock newsletter for DIY retirement investors. (review)
Fundrise — Simple real estate and venture capital investing for as little as $10. (review)
NewRetirement — Spreadsheets are insufficient. Get serious about planning for retirement. (review)
M1 Finance — A top online broker for long-term investors and dividend reinvestment. (review)