
Robust banks are a cornerstone of a healthy financial system. To ensure their stability, it is desirable for banks to hold a diverse portfolio of loans originating from various borrowers and sectors so that idiosyncratic shocks to any one borrower or fluctuations in a particular sector would be unlikely to cause the entire bank to go under. With this long-held wisdom in mind, how diversified are banks in reality?
Specialization in the Data
We make use of data from a confidential syndicated loan registry (SNC), which is maintained by the Federal Reserve, the Office of the Comptroller of the Currency (OCC), and the Federal Deposit Insurance Corporation (FDIC), to analyze lender diversification behavior. SNC data tracks all participants involved in large, syndicated loans (>$100 million) where a loan is held by two or more banks. As such, we can see the degree to which various lenders have chosen to invest in loans to different industries.
Using this data, we calculate the shares of an institution’s total syndicated lending in each industry. We can define a lender’s favored industry as the industry to which it has lent the most. There are twenty-four industries if we use the broad North American Industry Classification System (NAICS). Therefore, if bank portfolios are diversified, no single industry is likely to represent an overly large share of the average lender’s portfolio.
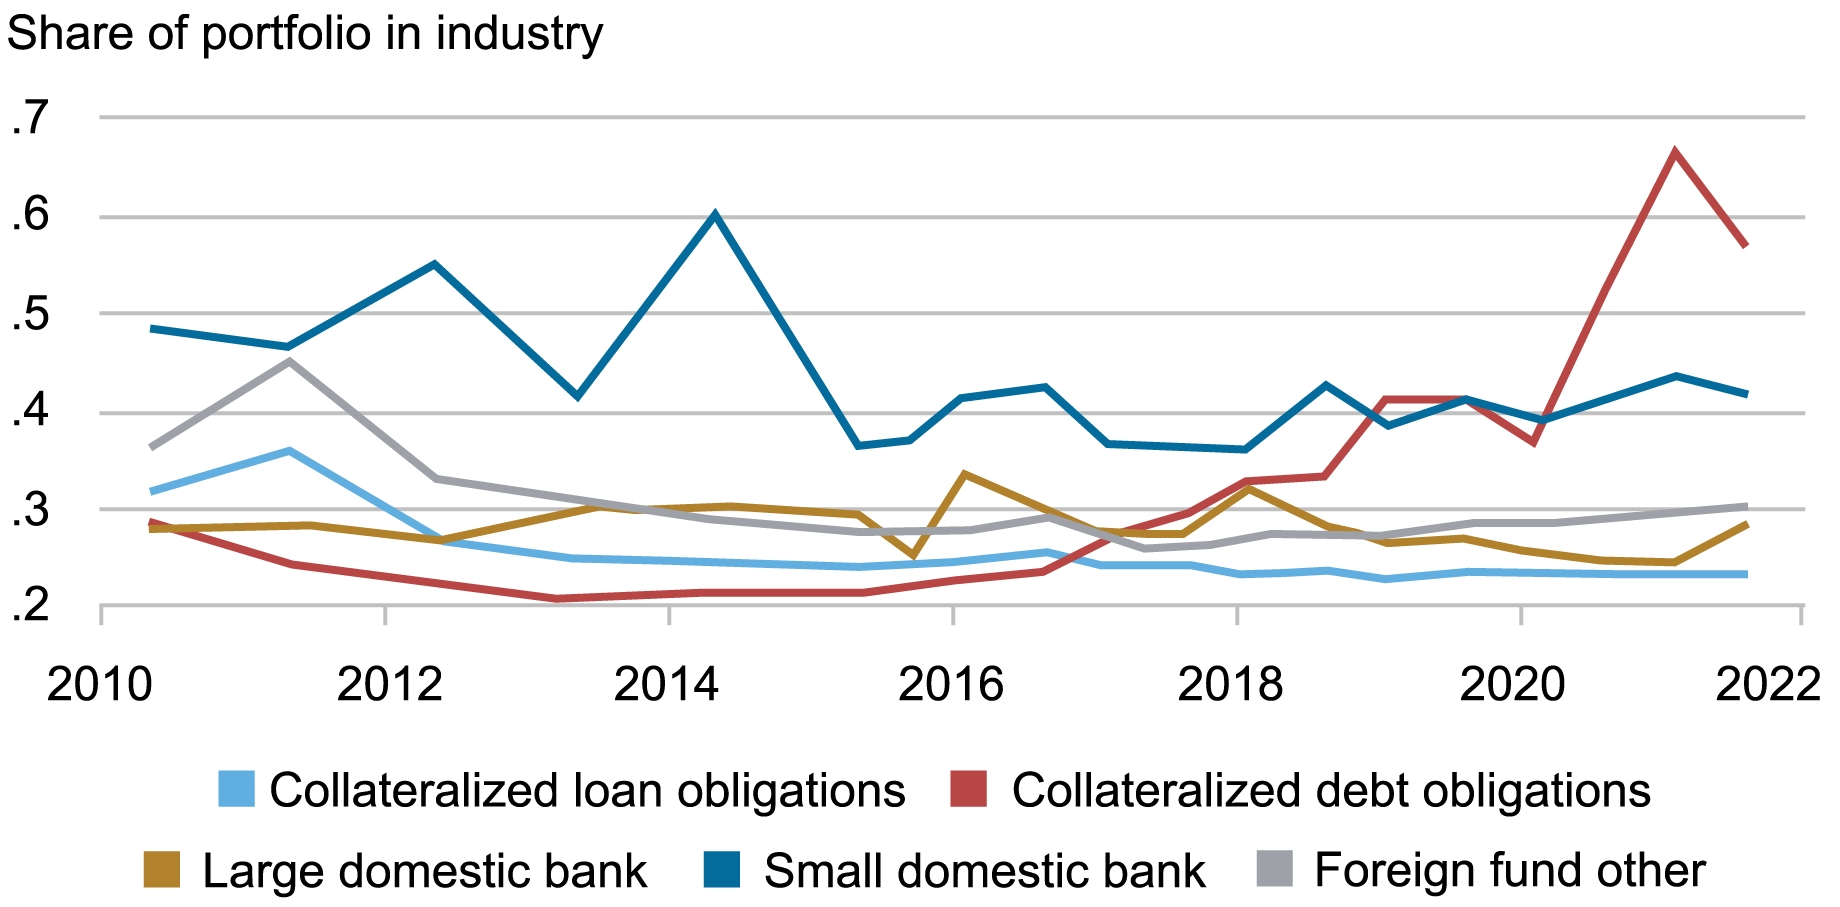
However, as can be seen from the chart below, the average lender in our data directs over 20 percent of their portfolio towards their favored industry. In contrast, if loans were evenly distributed across the twenty-four two-digit NAICS codes, then specialization would be only 4 percent. Even if loans were distributed in proportion to the size of a sector, the results would be different. Given that the largest industry in the United States makes up less than 15 percent of total GDP, we can argue that lenders are heavily specialized. It is also worth noting that not all banks specialize in the same industry; each bank has a different preferred industry.
Share Invested in Average Lender’s Favored Portfolio

Notes: The chart shows the average share of the commercial and industrial (C&I) portfolio that different lender types have invested in their favored industry. An industry is defined according to the first two digits of a NAICS code. We have twenty-four industries in our data.
As seen from the chart, different types of lenders may be specialized to different degrees. Specialization of large banks, along with that of collateralized loan obligations and foreign funds, hovers around 0.25 (meaning that 25 percent of commercial and industrial (C&I) lending directed towards the bank’s favored industry). High rates of specialization are particularly interesting for these large financial institutions. First, large institutions hold an overwhelming majority of all assets, so their stability is especially important. The result is also rather surprising since large banks have the capital to be able to diversify across multiple sectors.
Small domestic banks are even more specialized than large financial institutions, with specialization fluctuating around 0.4 to 0.5 (that is, 40 to 50 percent of C&I lending is directed towards the bank’s favored industry). This implies an extreme departure from diversification in the syndicated lending by these smaller institutions.
Finally, specialization of collateralized debt obligations has been between 0.2 and 0.3 from 2010 to 2016 but has been steadily increasing since then to be around 0.6 at the end of 2021.
Why Specialize?
There are several reasons why a bank may prefer to specialize their lending to a particular sector instead of diversifying. Some of these are discussed in detail in related papers: Blickle et al. (2024) deals with theoretical motivations and Blickle et al. (2023) deals with empirical practicalities. Repeated interactions between a particular bank and borrower may build up a positive relationship between the two. Also, a lender dedicated to a single industry may become good at evaluating borrowers in that industry, reducing the risks due to asymmetric information. In fact, a recent paper demonstrates that specialized lenders suffer fewer losses from unprofitable loans in their preferred industries, especially during stable economic periods. Similarly, the more a bank lends in an industry, the more information they will have about that industry, allowing them to make better judgments about loans in that sector and hence achieve higher profits. Even during COVID-19-induced shutdowns, specialized lenders saw better performance in their favored sectors, with loans by specialized banks being less likely to fail (during the period of January 2010 – December 2022).
Implications for Lending
Specialization or concentration in lending activities has several consequences. First, sector-specific shocks may destabilize banks. Although such events have not occurred recently, the possibility of an industry downturn disproportionately affecting different banks may be of concern to policymakers. Such an event may compound sector-specific issues, as a sector’s largest lenders are the most affected by that sector’s downturn. This may induce a feedback loop between the health of the sector and its largest lenders that greatly limits recovery. Second, specialization implies that banking activities are not fungible. The type of bank that grows or receives deposits may in turn affect the type of industries that grow. Research that treats banking activities as purely fungible—especially by highly specialized small banks—may inadvertently affect how capital is allocated to the productive sector.
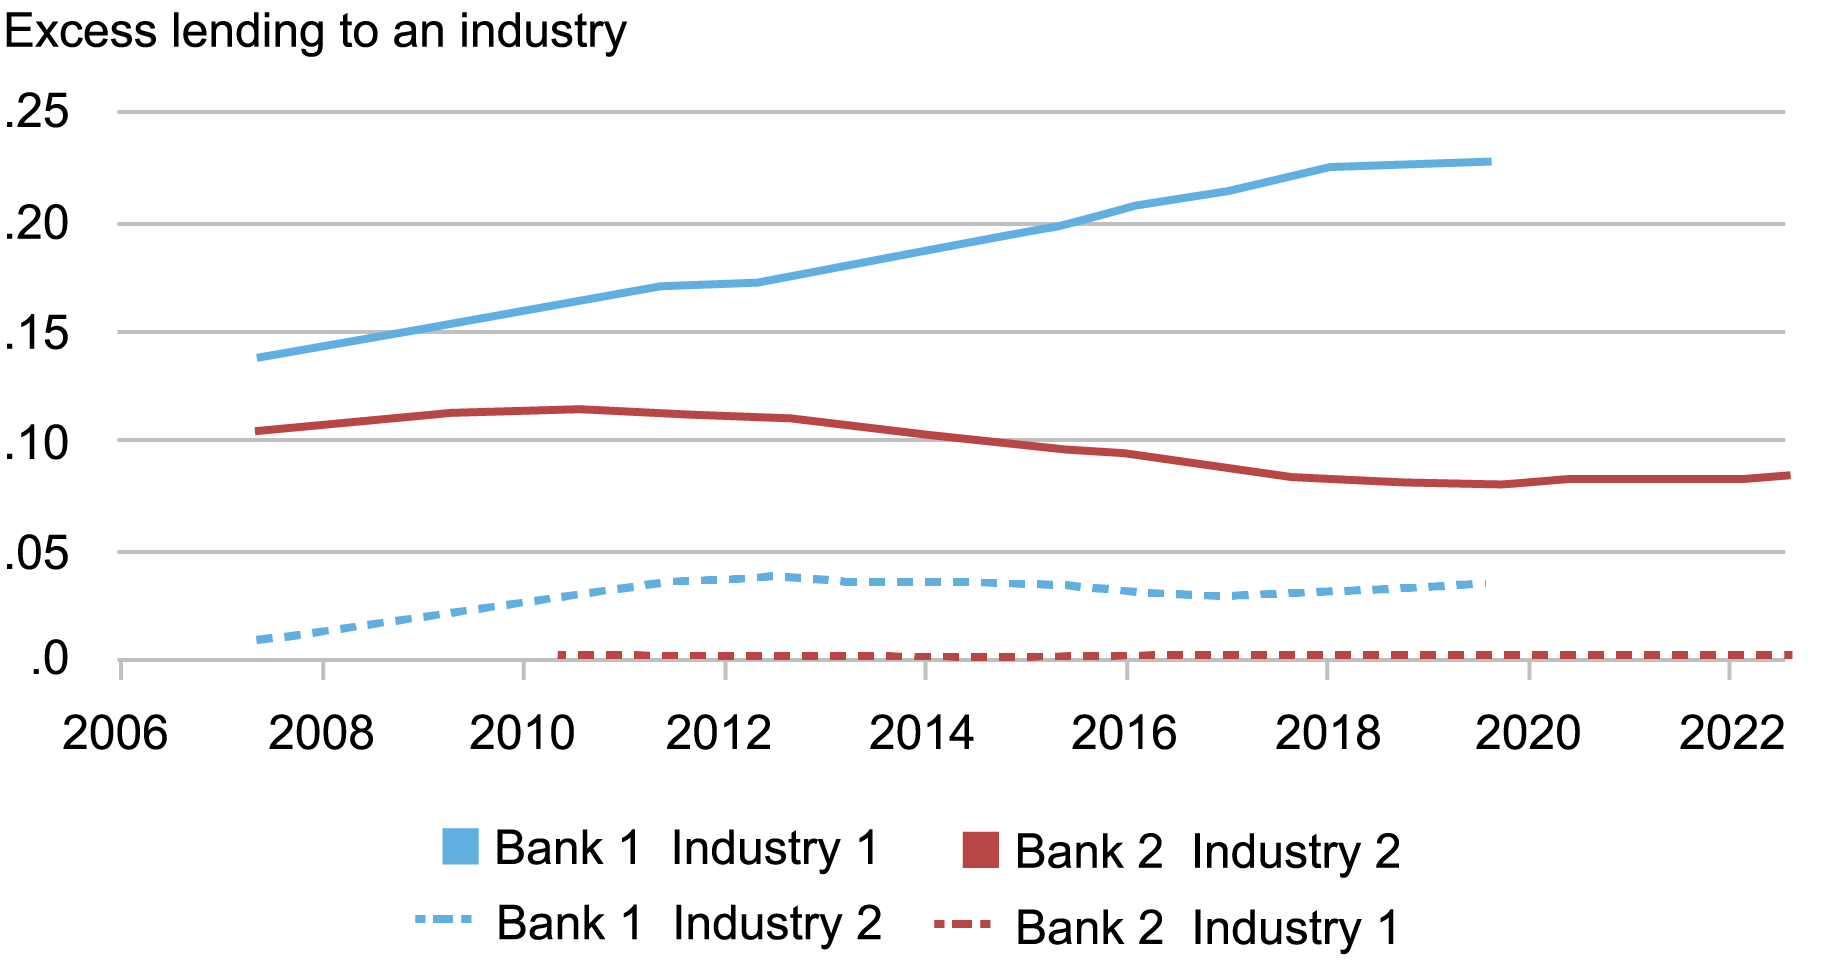
To illustrate the above point, consider the following chart of two very large banks’ specialization in two industries that appears in the data (bank and industry names are anonymized).
Share Invested in Lender’s Favored Portfolio

Notes: The chart shows the share of the commercial and industrial (C&I) portfolio that two different anonymized lenders have invested in their favored industry. It also shows how much each bank has invested in the other bank’s favored industry. An industry is defined according to the first two digits of a NAICS code.
Here, Bank 1’s favored industry is Industry 1 and Bank 2 specializes in Industry 2. However, each bank holds much fewer (if any) loans in the other bank’s industry of specialization. If Bank 1 receives a $1 billion inflow of deposits, which it can then loan out, it would make around $220 million of loans to Industry 1 and around $40 million of loans to Industry 2. Large-scale deposit reallocation, as occurred during the COVID-19 period and after the collapse of Silicon Valley Bank, can have large consequences for the sectoral distribution of lending. In other words, whether a borrower benefits or not could depend on whether their bank gained or lost deposits.

Kristian Blickle is a financial research economist in Climate Risk Studies in the Federal Reserve Bank of New York’s Research and Statistics Group.
Eric Gao was a research intern in the Federal Reserve Bank of New York’s Research and Statistics Group at this time this article was written.
How to cite this post:
Kristian Blickle and Eric Gao, “Documenting Lender Specialization,” Federal Reserve Bank of New York Liberty Street Economics, December 3, 2024, https://libertystreeteconomics.newyorkfed.org/2024/12/documenting-lender-specialization/.
Disclaimer
The views expressed in this post are those of the author(s) and do not necessarily reflect the position of the Federal Reserve Bank of New York or the Federal Reserve System. Any errors or omissions are the responsibility of the author(s).
Source link


