
The Federal Reserve (Fed) implements monetary policy in a regime of ample reserves, where short-term interest rates are controlled mainly through the setting of administered rates, and active management of the reserve supply is not required. In yesterday’s post, we proposed a methodology to evaluate the ampleness of reserves in real time based on the slope of the reserve demand curve—the elasticity of the federal (fed) funds rate to reserve shocks. In this post, we propose a suite of complementary indicators of reserve ampleness that, jointly with our elasticity measure, can help policymakers ensure that reserves remain ample as the Fed shrinks its balance sheet.
Complementary Measures of Ampleness of Reserves
As we explain in yesterday’s post, one could operationalize the notion of ample reserves as the region of the reserve demand curve where the slope is only modestly negative, which means that the elasticity of the fed funds rate to shocks in the supply of reserves is small. At higher reserve levels (abundant reserves), the elasticity is zero (that is, the curve is flat); at lower levels (scarce reserves), the elasticity is negative and large (the curve is steeply sloped).
The ampleness of central bank reserves, however, affects not only the fed funds rate but also other important money-market variables and bank liquidity management. In today’s post, we introduce four new indicators of reserve ampleness, which are complementary to our estimates of the slope of the reserve demand curve and work as an external validity check of our measure of reserve ampleness. Importantly, these indicators do not rely on the same sources of information as our elasticity measure because they do not use variation in the fed funds rate or quantity of reserves; rather they look at other variables that, based on economic theory and institutional details, should be affected by the ampleness of reserves.
- Late Payments
The first indicator is the share of interbank payments settled after 5 p.m. Throughout each business day, banks use their accounts at the Fed to make and receive payments, transferring reserves over a system known as Fedwire® Funds Service. As the supply of reserves declines and transitions from abundant to ample, banks have an incentive to postpone their outgoing payments, pushing the settlement towards the end of the business day to ensure they have sufficient reserves to settle their transactions (as explained in this paper).
- Banks’ Intraday Overdrafts
If banks’ ability to postpone outgoing payments is limited, they may increase their use of intraday credit provided by the Fed, known as daylight or intraday overdraft. A bank incurs an intraday overdraft when the balance in its account at the Fed is negative during the business day. As reserves become less abundant and banks more liquidity constrained, we would expect to observe more intraday overdrafts. To reflect broad liquidity conditions in the banking system, we take the average dollar value of banks’ intraday overdrafts as an indicator of the relative ampleness of reserves.
- Domestic Borrowing in the Fed Funds Market
As discussed in this post, domestic banks predominantly borrow in the fed funds market when they need short-term liquidity, whereas U.S. branches of foreign banks actively borrow in that market to earn the spread between the rate of interest on reserves (IOR) and the fed funds rate, even when they are awash with reserves. An increase in the volume of fed funds borrowing by domestic banks could therefore signal that reserves are becoming less abundant as banks are more liquidity constrained.
- Upward Pressure in Repo Rates
Rates on overnight repurchase agreements (repos) can influence the fed funds rate because repos and fed funds are close substitutes for many market participants. Moreover, as discussed in several papers (see here, here, and here), lower reserve levels can increase repo rates by tightening the liquidity constraints of large banks active as repo intermediaries. We measure upward pressure in repo rates as the share of overnight Treasury repo transacted at or above IOR.
Looking at the Suite of Measures Jointly
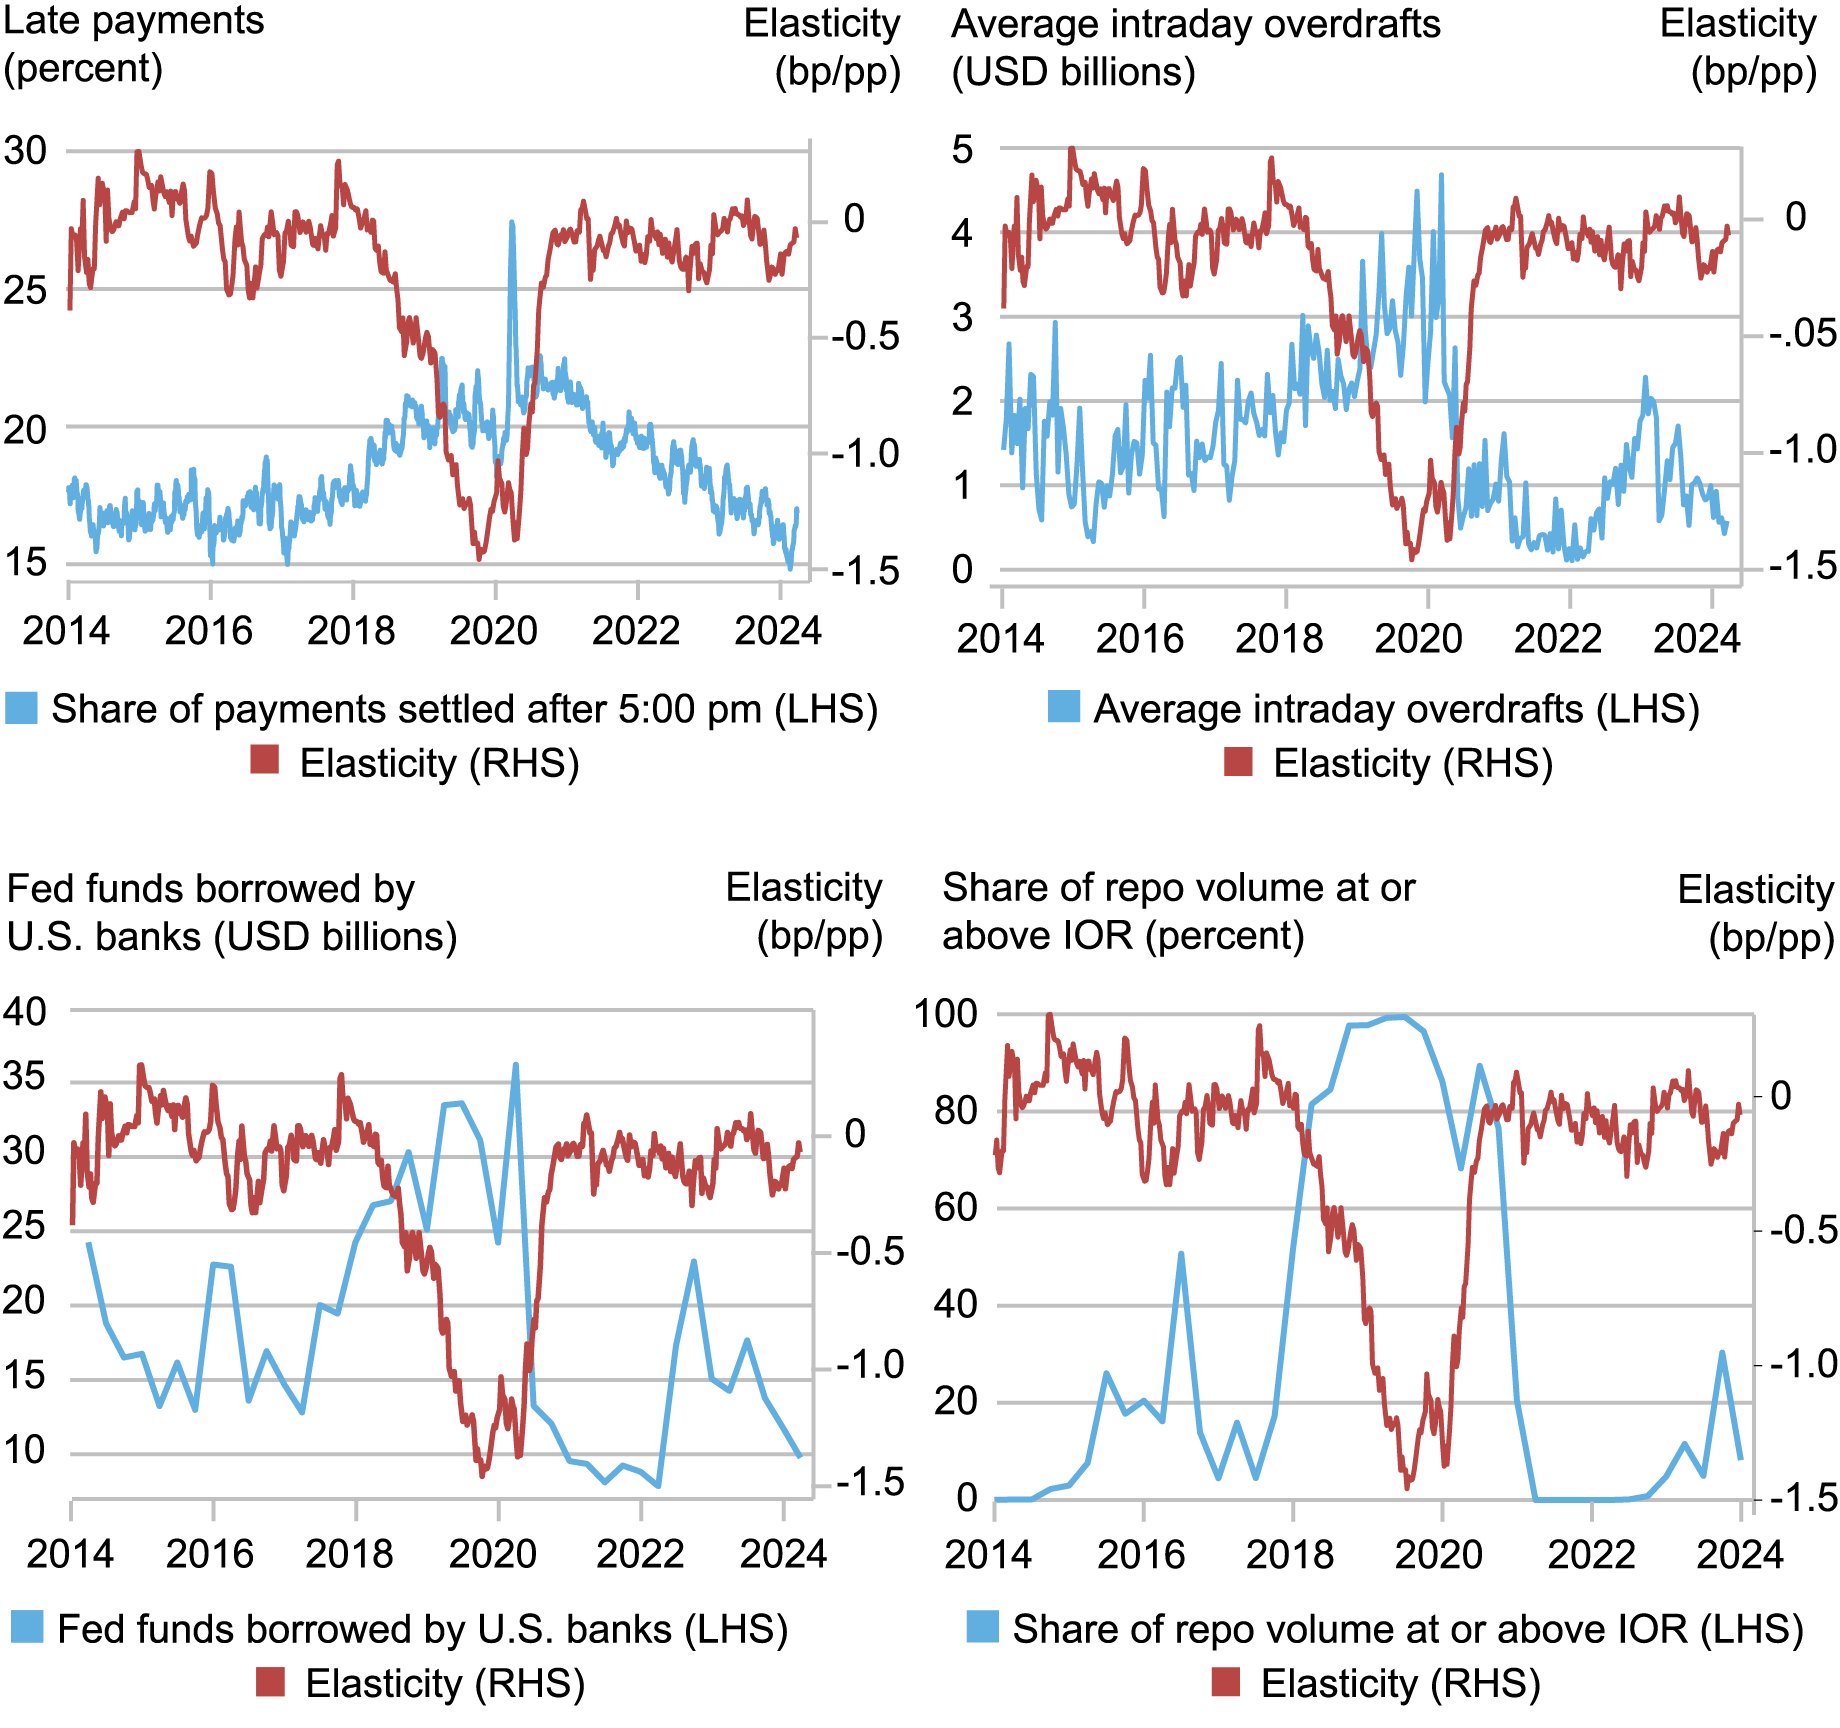
By construction, all these indicators should increase as aggregate reserves transition from being abundant to ample and then scarce. Indeed, the chart below shows that, over time, our four complementary indicators of reserve ampleness have been consistent with our real-time estimate of the fed-funds-rate elasticity to reserve shocks. In each panel, we plot one of the indicators and the real-time elasticity estimate: in all cases, the complementary indicators increase as the fed-funds-rate elasticity decreases, indicating a decline in reserve ampleness. In particular, all complementary indicators start to trend upward—suggesting that reserves were transitioning from being abundant to ample—around the end of 2017 or beginning of 2018, when the elasticity becomes negative for the first time since 2014. The indicators then reach a maximum between September 2019 and March 2020, as our real-time elasticity measure reaches its minimum, indicating the greatest scarcity of reserves over the last ten years. Since then, they have gone back to their 2014-17 levels, suggesting that reserves have been abundant over the last four years, consistent with the elasticity being zero.
Indicators Increase as the Elasticity and Reserve Ampleness Decline

Notes: This panel chart plots four complementary indicators of reserve ampleness versus time-varying estimates of the fed-funds-rate elasticity to reserve shocks. “Late payments” is the share of Fedwire® Funds Service payments settled after 5 p.m. ET. “Average intraday overdrafts” is the average per-minute daylight overdrafts for all institutions over a maintenance period. “Fed funds borrowed by U.S. banks” is the dollar value of fed funds borrowed by domestic banks. “Share of repo volume at or above IOR” is the share of repo transactions traded at rates at or above the rate of interest on reserves. The views expressed in this post do not represent the views of the Office of Financial Research, the Financial Stability Oversight Council, or the U.S. Department of the Treasury.
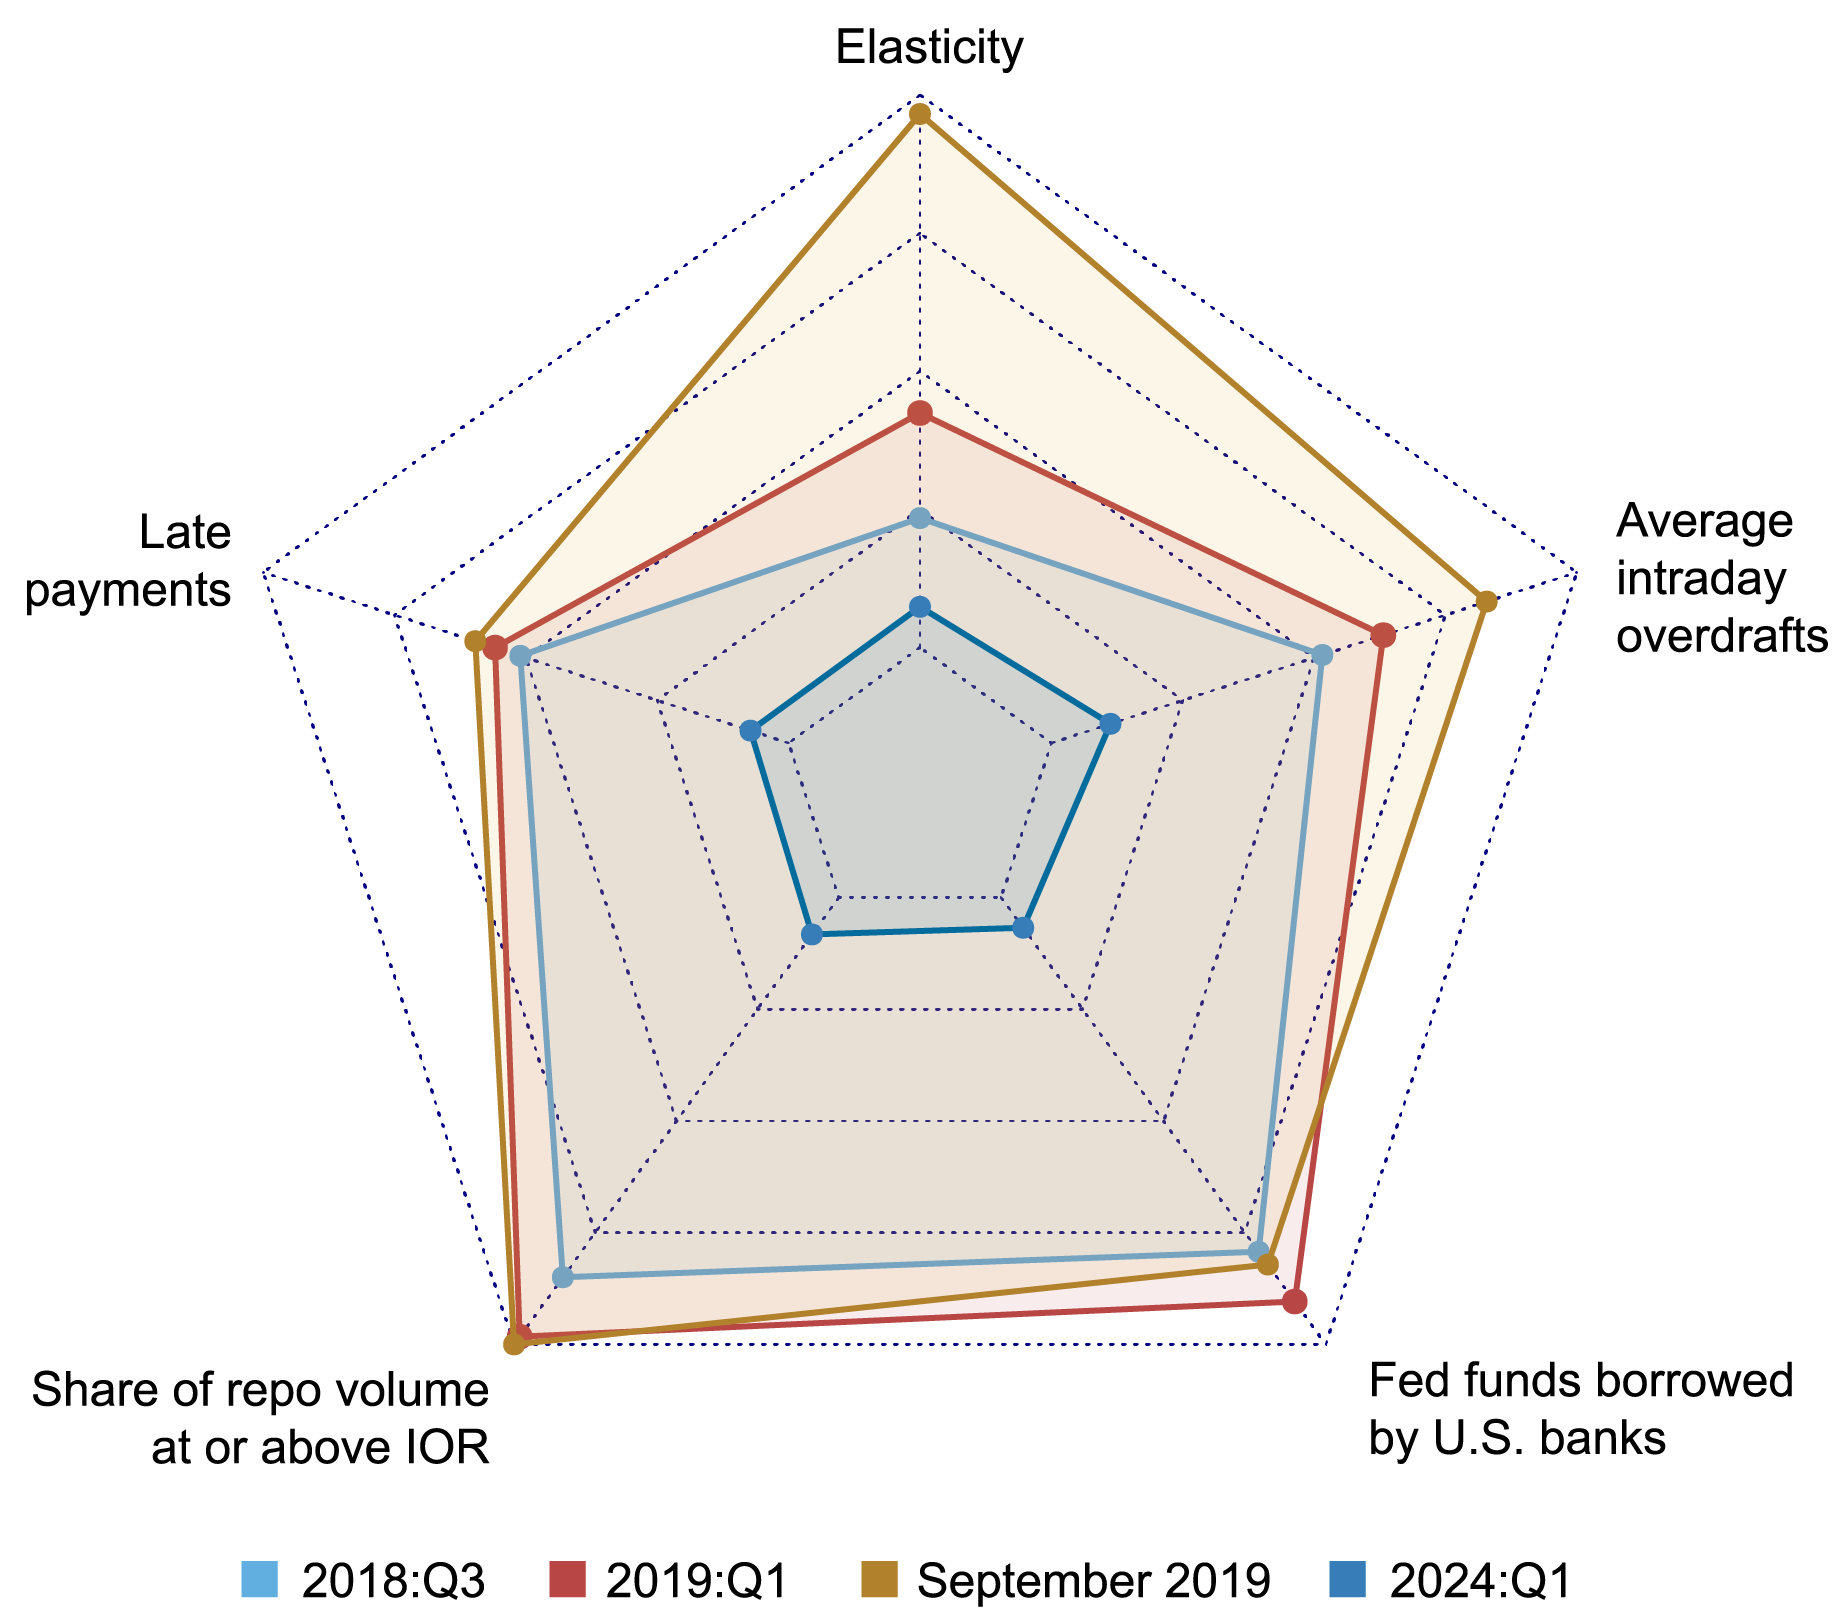
The following spider web chart shows the four complementary indicators together with (the absolute value of) our measure of the elasticity at four different points in time: 2018:Q3, 2019:Q1, September 2019, and 2024:Q1. For each indicator, the point on the respective axis in the innermost dashed pentagon represents the level of most abundant reserves during 2014-2024:Q1 according to that indicator; the point on the indicator’s axis in the outermost pentagon corresponds to the level at which reserves were most scarce. As of the first quarter of 2024, all indicators suggest that reserves remain abundant and far from their 2018-19 conditions.
Reserves Remain Abundant as of 2024:Q1

Notes: This spider web chart plots, in four different periods, five measures of reserve ampleness: the fed-funds-rate elasticity to reserve shocks and four complementary indicators. The elasticity becomes significant at the 68% confidence level in 2018:Q3 and at the 95% confidence level in 2019:Q1. The 2024:Q1 Call Report is the last available report. Overdraft data are publicly available up to the maintenance period ending on March 20, 2024. The views expressed in this post do not represent the views of the Office of Financial Research, the Financial Stability Oversight Council, or the U.S. Department of the Treasury.
In Sum
Monitoring reserve ampleness is a key task of the Fed, particularly amid the ongoing balance sheet reduction process. In yesterday’s post, we proposed a measure of reserve ampleness based on estimating the slope of the reserve demand curve (that is, the elasticity of the fed funds rate to changes in aggregate reserves) at the daily frequency. In this post, we propose a suite of complementary indicators based on different data that describe conditions in money markets and bank liquidity, whose evolution over time is consistent with our estimates of the fed-funds-rate elasticity. These indicators, jointly with our real-time elasticity estimates, can help inform policymakers on whether aggregate reserves in the banking system are becoming less abundant and potentially scarce.

Gara Afonso is the head of Banking Studies in the Federal Reserve Bank of New York’s Research and Statistics Group.

Kevin Clark is a Capital Markets Trading Principal in the Federal Reserve Bank of New York’s Markets Group.

Brian Gowen is a Capital Markets Trading Principal in the Federal Reserve Bank of New York’s Markets Group.

Gabriele La Spada is a financial research advisor in Money and Payments Studies in the Federal Reserve Bank of New York’s Research and Statistics Group.

JC Martinez is a research analyst in the Federal Reserve Bank of New York’s Research and Statistics Group.

Jason Miu is a Capital Markets Trading Associate Director in the Federal Reserve Bank of New York’s Markets Group.

William Riordan is a Capital Markets Trading Advisor in the Federal Reserve Bank of New York’s Markets Group.
How to cite this post:
Gara Afonso, Kevin Clark, Brian Gowen, Gabriele La Spada, JC Martinez, Jason Miu, and Will Riordan, “A New Set of Indicators of Reserve Ampleness,” Federal Reserve Bank of New York Liberty Street Economics, August 14, 2024, https://libertystreeteconomics.newyorkfed.org/2024/08/a-new-set-of-indicators-of-reserve-ampleness/.
Disclaimer
The views expressed in this post are those of the author(s) and do not necessarily reflect the position of the Federal Reserve Bank of New York or the Federal Reserve System. Any errors or omissions are the responsibility of the author(s).
Source link


